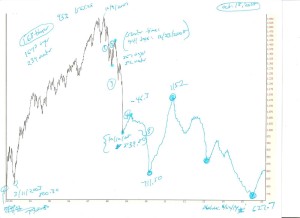
Chart shows the Hand-Drewed picture of S&P500 chart by Tim Knight author of Slopeofhope
Archive for the ‘World Indices’ Category
Long Term Prediction of S&P500 by Tim Knight
February 5, 2010Ichimoku Weekly Cloud Chart for Nifty, Shangai Composite and Hang Seng
February 1, 2010Weekly Charts of Nifty
Weekly Charts of Hang Seng
Weekly Charts of Shangai Composite
From the above shows the Ichimoku cloud charts(Weekly) of Nifty(India), Shangai Composite(China) and Hang Seng(Hong Kong). All the above charts convey only one single information to investors. i.e these indices are trading very close to the Ichimoku cloud supports and the breakdown will lead to the true start of the bear market until then playing with Equity longs are safer.
Ichimoku Cloud Supports on Weekly basis
Nifty – 4800(Very Close to cloud Supports)
Hang Seng – 20000(Very Close to clould supports)
Shangai Composite – 3000(Almost Broken)
Related Readings


